Introduction to Website Performance
This means that if you click on that link and purchase an item I will get a commission, at no extra cost to you!
An important key factor in the success of your blog is the performance of your website. It affects how visitors experience your website, but it also has an impact on your ranking in Google.
In this post, I zoom in on how The Side Gig Longlist performs, give you an introduction to website performance, and show how you can improve it while doing so.
What Are We Going to Do?
There are many different things that can affect a website’s performance, both positive or negative. I think that it is essential to be aware of what affects your performance when you are running a blog, even if you just add or edit content.
As it is quite a big topic, it seemed to me that splitting it up would be best.
This post will give you an introduction and give you 3 tips on what you can do to start improving your performance right away.
It will become a bit technical now and then, but don’t worry. I will guide you through it and keep it in plain English.
Why not Fix Bug X or Y First?
You probably have found some bugs on this website and may be wondering why I don’t choose to fix those first.
Unfortunately, there are just 24 hours in a day. I have to share this with my 9-to-5, trying out things I blog about and writing content.
As long as I can cherry-pick the bugs and improvements that provide nice content to write about, I will prefer those.
Don’t worry. All bugs I discover go to my to-do list. If you found one, don’t hesitate to contact me about it.
Managing Todo Lists
Here is a tip about a tool I use to keep track of things to do: Trello (it’s free).
I use Trello to keep a list of bugs, improvements, and goals.
You can create multiple boards, lists, and cards (actions, notes, etc.) and share them with your team, even with the free version.
Every column you see is a list, and you can add multiple cards to a list.
Each ‘line’ is a card, and you can store notes, checklists, links, etcetera in it by opening them.

Try it! It helps me to track my tasks.
Now, let us get back to what this post is about: an introduction to website performance.
Website Performance
Generally speaking, performance, or web performance, is about the speed of a website, both as objectively measured as perceived by its visitors.
In this article, I focus on the first. I have written a post about the Core Web Vitals, the new ranking factors of Google, in which the perceived performance is explained.
Don’t forget to read that one! I will remind you at the end of this post.
Under the Hood
As soon as a visitor requests a webpage, there are a lot of things that need to be done before your visitors can view the page in its entire glory.
Let’s go through this process (simplified):
Your browser tells your router that it needs a webpage by its URL.
That request is handed to a domain name server (DNS) that will find out where the page is hosted on the world wide web.
It has to look up the IP address of the domain (the first part) of the URL. The request for the page is then sent to the server at that address.
Your web server will then look for that page, generate the HTML (the language that browsers understand) and send that back to you.
Depending on the content and the components you use, this may take some time.
Back to the Browser
Now your browser starts to ‘read’ and process the received HTML line by line.
It will find all kinds of things there, for instance, that the page has a design (CSS) and that the design is located in a CSS file.
To get each file (there are often multiple CSS files), it will send an additional request to the server.
The chances are that your website also uses JavaScript. These scripts are also separate files that it needs to request.
Even if you haven’t added JavaScript yourself, it might be needed for the WordPress theme you use, the plugins you have added (social media, cool features, or even plugins that improve the performance), or the things you do to keep track of visitors (for instance, Google Analytics)
The same thing applies to images, fonts, icons, etcetera.
Every request will have to be routed, processed by the server, routed back, and processed by your browser again.
Visualizing The Above
If you visualize all these requests, it could look like this (this is the request map for the Take Surveys page).
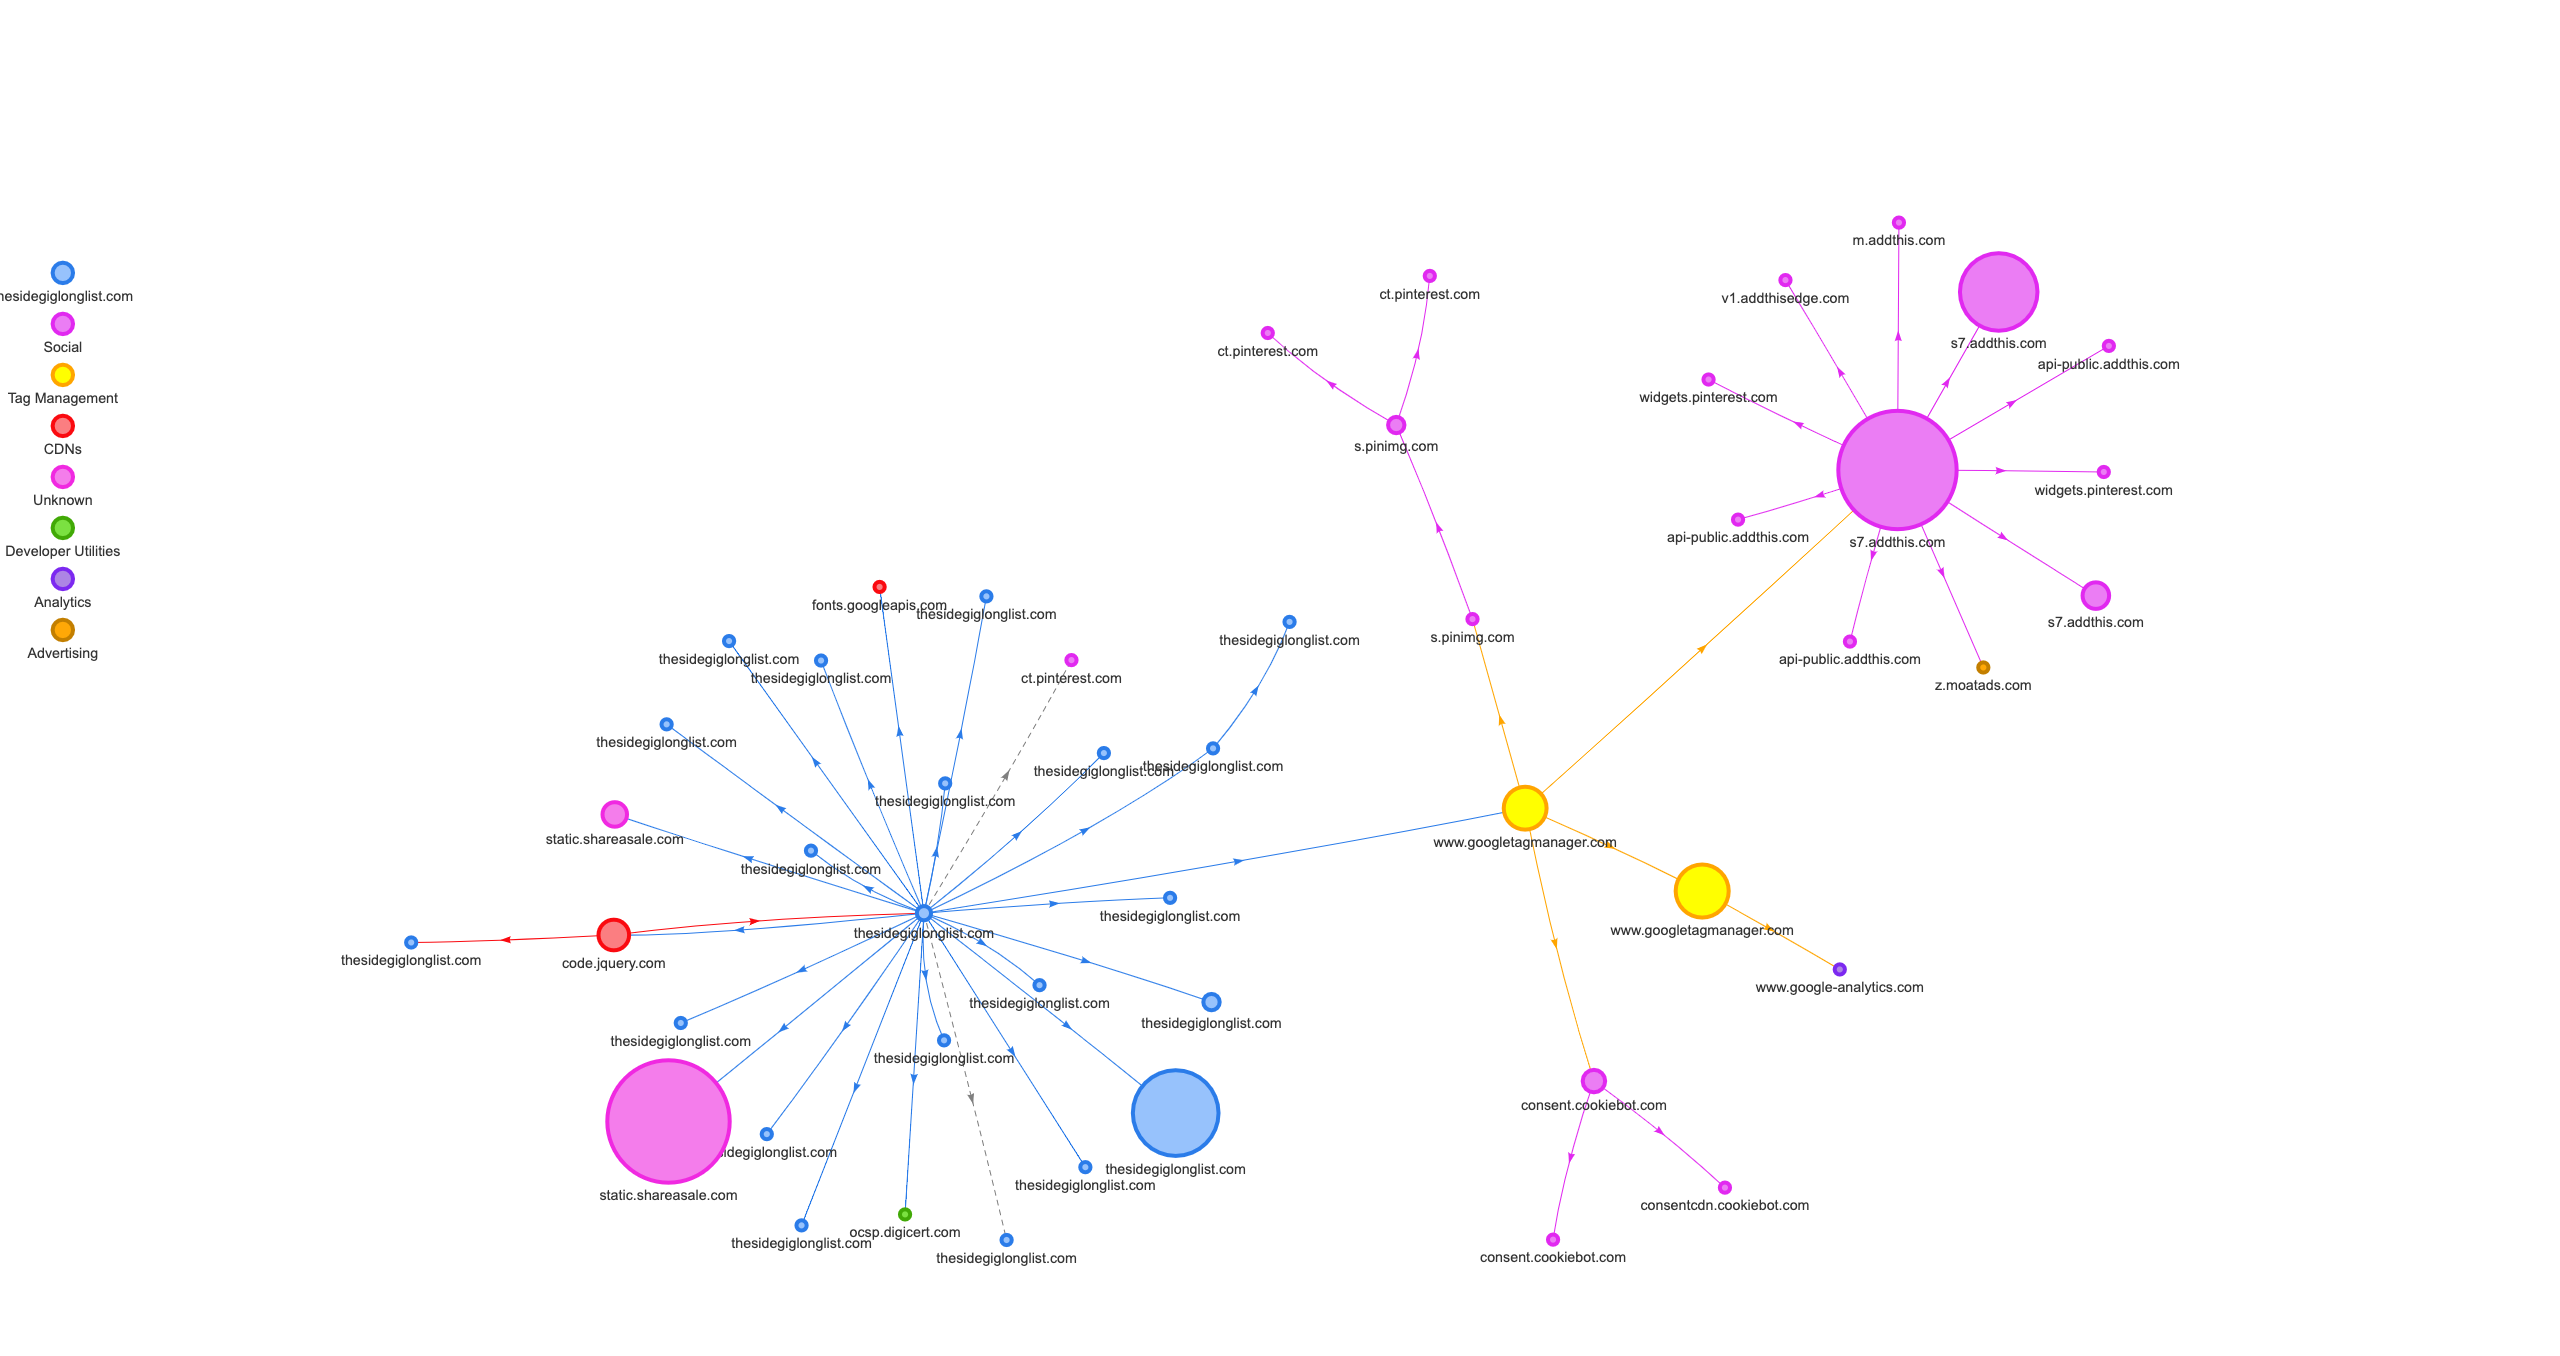 Every dot is a file that your browser needs to complete the page. Bigger dots are bigger files.
The blue dots are on my own domain (CSS, JavaScript, images), the other colors represent files on other domains (ads, Google Analytics, etcetera).
You can create a request map for your own pages at Requestmap on Heroku.
How to Find Performance Issues
Needless to say that, given the fact that a lot of different factors can influence all the different steps I mentioned above, this can get very complex, very fast.
The way I see it, you have three options to start working on the performance of your website: Learn all there is to learn and become an expert(1) or use the knowledge that other experts have put in the available tooling(2).
Side Gig
I mention becoming an expert because it creates an opportunity for you to start a side gig by offering your freelance services, for instance, on Fiverr.
You could also hire a freelancer(3) there that optimizes your website for you.
Personally, I like to learn, and I like learning by doing.
Useful tools that give me enough information to start investigating are important to me. It will save me time from learning things I do not need, just because it isn’t an issue at the time.
This sounds a little reactive, and that implies a risk of not preventing things before they become a problem, but as you start learning, you will pick up a lot of knowledge ‘on the side.’
What Performance Tools are There?
These types of questions are almost always rhetorical, as you might have guessed that the answer is: there are a lot of different tools.
If you Google ‘measure website performance, you will find the tools you can get started with on the first search result pages.
I’ll stick to the tools I use in this post, but feel free to share yours in the comments!
I Start with Lighthouse
Lighthouse is available as a browser plugin, and it is already included in Google Chrome. If you prefer to use other browsers, then you can try its online version at web.dev.
I like to start with Lighthouse because of the user-friendly design and informative messages.
This will give me a general understanding of the problem areas.
Let me show you where to get it and what I get from Lighthouse.
Where to Find It
Open your website in Chrome and press ALT-CMD-I (macOS) or CTRL-SHIFT-I (Windows).
You should see Chrome’s Developer Tools appear. Find the ‘tab’ that says Lighthouse and click it.
You will probably see something that looks like this:
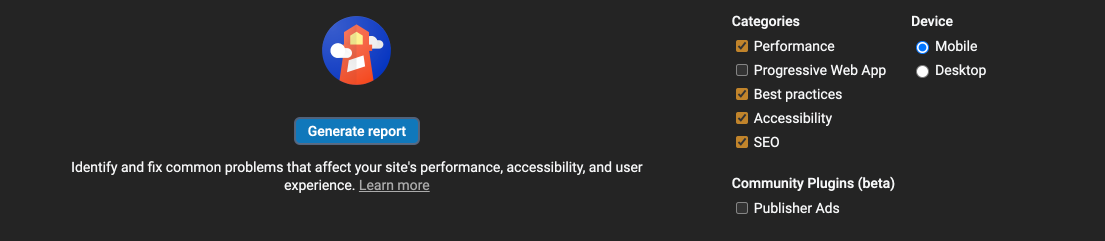
Now select the categories that you would like to be included in your report. I suggest you copy the settings from the above screenshot.
It is important to set the device. Performance on a desktop is most likely to be better than mobile performance. Pick the one you would like to test now.
You can generate as many reports as often as you like. It is completely free, so don’t worry about free tries getting reduced.
Using the Generated Report
Lighthouse will generate the report in the browser, and it will give you the scores first. These scores rank from 0 to 100, where 0 is absent, and 100 is fabulous.
These are the scores of the Take Survey pages (10-12-2020) on a desktop device:

I am quite happy with that, but the performance score used to be in the green after the first run of optimizations I had performed.
Since then, there were a few changes, for instance, I added some plugins, and apparently, they affected the performance.
The performance score can vary a little per report. One of the reasons that this might happen is that a server might be more (or less) busy due to traffic. If you would like to learn more about the scoring, then read their Lighthouse Scoring Performance.
Tip: run a couple of reports and run them in a fresh browser session. Open a new anonymous browser session for each report. This should give you an average score to work with.
Finding the Issues
If you scroll down in the report, you will find the main issues being highlighted:

As you can see, there are a couple of items marked with a red triangle, indicating that they did not pass the test or did not score well.
Let’s zoom in on the first one: ‘Eliminate render-blocking resources.
Clicking on the line will expand it.
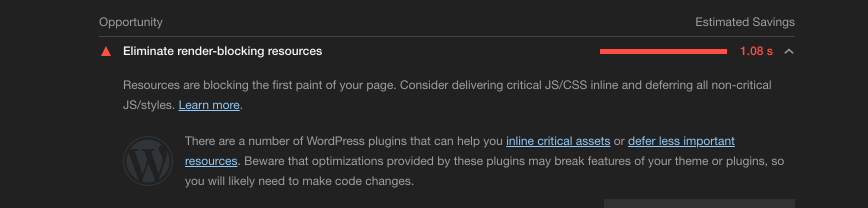
Lighthouse provides us with an explanation of what the issue is, and following the ‘Learn More Link‘ will bring us to a page with detailed information.
It even provides me with WordPress specific suggestions about plugins that may aid in solving one or more of these issues (like WP Rocket or ShortPixel)
There is also a list of files that cause this issue, but I don’t want to go too deep into the details. Let’s save that for another post.
After the test, I add all issues found to my Trello ‘Bugs and Maintenance’ list so that I can prioritize what has to be done first and what may be solved later.
I like Lighthouse. It provides me with a quick way to find problem areas and helps me to resolve the issues by explaining what is going on and where I can find more information.
WebPagetest by Catchpoint
WebPagetest is another free, browser-based tool that I like to use, and it can be found at webpagetest.org.
It gives me another, more technical perspective, but all the extra information that they give will help you understand the issues it finds better.
On their homepage, you will find a form like this:

The same principle applies. Enter your URL and make sure to select the device you want the test to run on (it is in de Test Location dropdown) and hit that yellow Start button.
Your test(s) will be added to the queue, so if it is busy, you will have to wait for a little while for the results to appear.
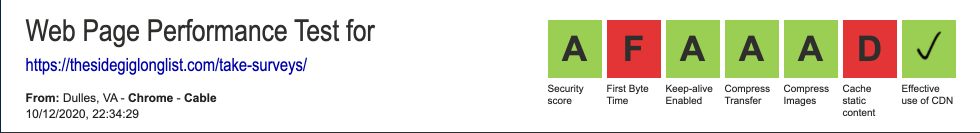
The Report
The report will appear on the same page and is divided into a couple of sections. The header will give an overview of your grades:
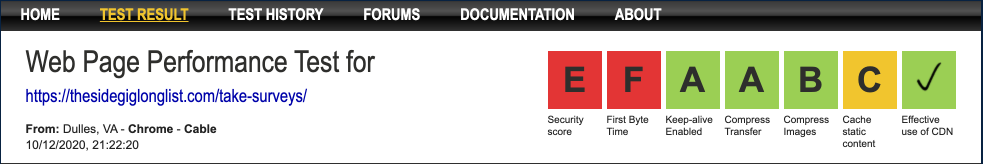
There is room for improvement, but the ‘E’ for Security bothered me the most at the moment.
If you click the grades, it will take you to pages with more information.
I did this for the Security issues, and luckily these were easy to fix.
Somehow it affected the Cache Static Content grade, but I’ll dive into that later.
Now that this is fixed let’s get back to the introduction to website performance.
What Are These Grades?
They give you an indication of how well you perform on some key factors.
Security score
The Security test checks for known security issues. In my case, there were some issues with the headers, which left my site vulnerable to certain attacks. After the fix, the grade went up.
First Byte Time
The First Byte Time measures the time it takes from the request to the first byte received by your browser.
If this grade is too low (it takes too much time), it may be an indication that there are issues with the server processing the request.
Maybe it has to fetch too much data from a slow database; maybe the server has to create a page on the fly.
Fetching data from different sources (which I suspect is the cause of my ‘F’) could be the issue, or maybe some other element on the page is the culprit.
Keep-alive enabled
Keep-alive means that the browser keeps the connection to the server open.
Remember that I explained that your browser also has to fetch the CSS and JavaScript files? If Keep-Alive is ‘off,’ every request will have to look up where the server is first before it can be sent there.
Compress transfer
Compress transfer is about the size of all the data being sent.
Have you ever used ZIP files? Zip files are compressed, so they take up less space on your disk. Compress Transfer is about zipping the data that is sent.
You do not have to do this yourself. It is a configurable setting on your webserver.
Compress images
You would say that Compressing images is comparable to compressing data, but it is not quite the same. What image compression does is actually remove data from the image.
This data can be metadata (information about the image that is encapsulated) or visual data. Most of us don’t see all the different shades of gray, so optimization tools will reduce these to less different variations.
Depending on the compression level, you will start to notice a difference in quality, so this is a balancing game.
Too little compression means that your images are too large and will take more time to be sent to the browser, whereas too much compression will affect the quality of your images.
There are tools that will help you compress your images. I have ImageOptim installed on my MacBook, but TinyPNG can also be used in your browser.
If you don’t like to preprocess all images before uploading, then I suggest a good plugin that takes care of that for you. At the moment, I am using Smush, but the ShortPixel plugin looks promising. I might try that one too.
Cache static content
The Cache grade tells you if files that do not change very much are kept in the browser long enough. This way, they do not have to be requested every time.
You can imagine that this will have a positive effect on the performance of your website.
Without going too deep into this rabbit hole, though, there is also a downside to it, as changes in these files may not be available to your visitors right away.
There are ways to work around this, but again, that’s another article.
Effective use of CDN
The final grade is about using a Content Distribution Network (CDN).
What this basically does is copy the content from your server and store it on a lot of servers worldwide.
Whenever you request one of those files, the CDN will find a server near you and serve it from there.
This way, your own server has to work less hard, and the content can be delivered faster.
Cloudflare may be one of the most popular CDN providers. They also offer services to protect your website from several types of attacks.
Other Features
Like I said before, WepPagetest gives me another perspective on the issues. They have a lot of different features, summaries, and visualizations that will help you to view the issues from all sides.
It is, however, fairly technical, and you will have to use the extra information they give you to get a grasp of what the numbers mean.
One of these visualizations is the Waterfall View:

It tells me, in one view, what I could also deduct from the numbers: It takes too much time to fetch the HTML from my server.
How I am going to analyze the issue and how to fix this is material for another post. Most likely, I will make a copy of that page and start to remove elements until I see a significant change. This should give me a hint.
Wrapping It Up
By now, I hope that you have a better understanding of what might influence your performance. I would like to wrap up the introduction to website performance with a summary and some tips.
You now have some tools to start with if you would like to find out if there are any problems with the performance of your website. These tools might also give you a starting point for finding out how to fix it.
Balancing
I mentioned it a few times: it is a balancing game. Everything you add to your page has a price. Some performance improvements may be solved by reducing things that make your life, as a blogger, much easier.
You will have to decide what ‘price‘ you want to pay.
I plan to add more performance-related posts, zooming in on one specific area, so keep an eye out.
Tips to Improve Your Performance
As the solution to performance issues depends on the type of issue, it is impossible to give you a single tip, but here are 3 giveaways:
1. Self-host
Don’t use a blogging platform, but get your own hosting provider.
Blogging platforms are great and will get you up and running in no time, but you will be restricted in the type of plugins you can install and the level of control you have over your files (remember what I said about the ‘price’ to pay?).
To fix some of the issues, you will need full control over what you can install, and you will need access to files.
The security issue I mentioned earlier was fixed by adding 3 lines to the so-called .htaccess file. This file will not be editable on all blogging platforms.
I know that it might seem a bit scary to have to install WordPress on your own server, but providers like Hostinger and NameCheap have one-click and guided installations that will have your website up in no time.
You can also check out my How to Start a Blog as a Newbie to get more information.
2. Compress Your Images
I have mentioned this before, but compress your images! Large images (as in images of 400KB or more) are one of the most common performance killers.
Don’t use the image straight from Photoshop, Canva, or other applications that you might use.
Run it through an image optimizer like ImageOptim or install plugins like Smush or ShortPixel that will do the work for you.
3. Clean Up
All those referenced but unused files will have to be fetched.
Even if you do not use a specific javascript or CSS file, if the HTML says that it needs to be loaded, it will.
The most common cause of unused files is neglecting to deactivate (and remove) plugins that you do not use anymore.
4. (I know how to count to 3, but this is a bonus)
Use plugins that will help you minimize the CSS, JavaScript, or HTML files. Often these plugins will also let you combine multiple files into one.
One single request is faster, but if the file gets too big, it will increase the loading time. It is all about balance. There is the balancing part again.
A plugin that does this is WP Rocket. It also handles compression and caching, so that is a lot of optimizations with one plugin!
Update:
I am going to call it a day, so here is what today brought me:

In a later ‘Fix-It Friday,’ I will tell you more about what I have done to improve these scores. I made notes; I ‘only’ have to write a post around it.
What’s Next
First, the promised reminder: Core Web Vitals.
Well, if you liked this post, then I would really appreciate it if you shared it on your social media.
Thank you for visiting! You are awesome!
Recommended Reading
- How I Reached a Nearly Perfect Web Page Performance Score
- What are Core Web Vitals
- How Long Does it Take to Increase Domain Authority
- Where to Find Infinite Content Ideas
- Free Courses to Boost Your Blog